The Math Toolkit reviews five subjects that are especially relevant to engineering and music.
How do sine waves relate to music?
A sine wave is a very simple way to represent a repetitive signal, and it gives us a foundation for analyzing more complex sounds. It’s possible to split a sound up in lots of ways, for example, synthesizers often use square, triangle, and sawtooth waves to create complex sounds. But engineers prefer sine waves to analyze sounds because the math is much easier to work with.
Any repetitive signal can be broken down into individual sine waves that have the same period as the original signal. An engineer can then analyze each sine wave one at a time and put them back together, modeling the original sound. Being able to analyze sine waves can also help us understand the principles behind familiar musical products, like noise cancelling headphones, which work by calculating differences in phase.
What are sine waves?
Sine waves come from trigonometry, which is the study of how the side lengths and angles of a triangle affect each other. According to trigonometry, the “sine” of any given angle of a triangle is the length of the opposite side divided by the length of the longest side of the triangle- the hypotenuse. But this “sine” of a triangle is just one value, and the sine we’ll consider is those single sine values as a function of time.
Now imagine that same triangle is a right triangle and you draw a circle around it, where the hypotenuse is the radius of the circle and the vertex of the angle we were referencing before is the center. See this visual representation of the sine of a center angle of a triangle inscribed in a circle.
If we spin the circle, we add the dimension of time, because it takes a certain time for the circle to complete each rotation. If you take the sine of that initial angle we mentioned before as the circle completes a 180 degree rotation, you’ve created a sine wave, which is the sine of that center angle as a function of time. See this visual representation of how a sine wave is derived from a spinning circle.
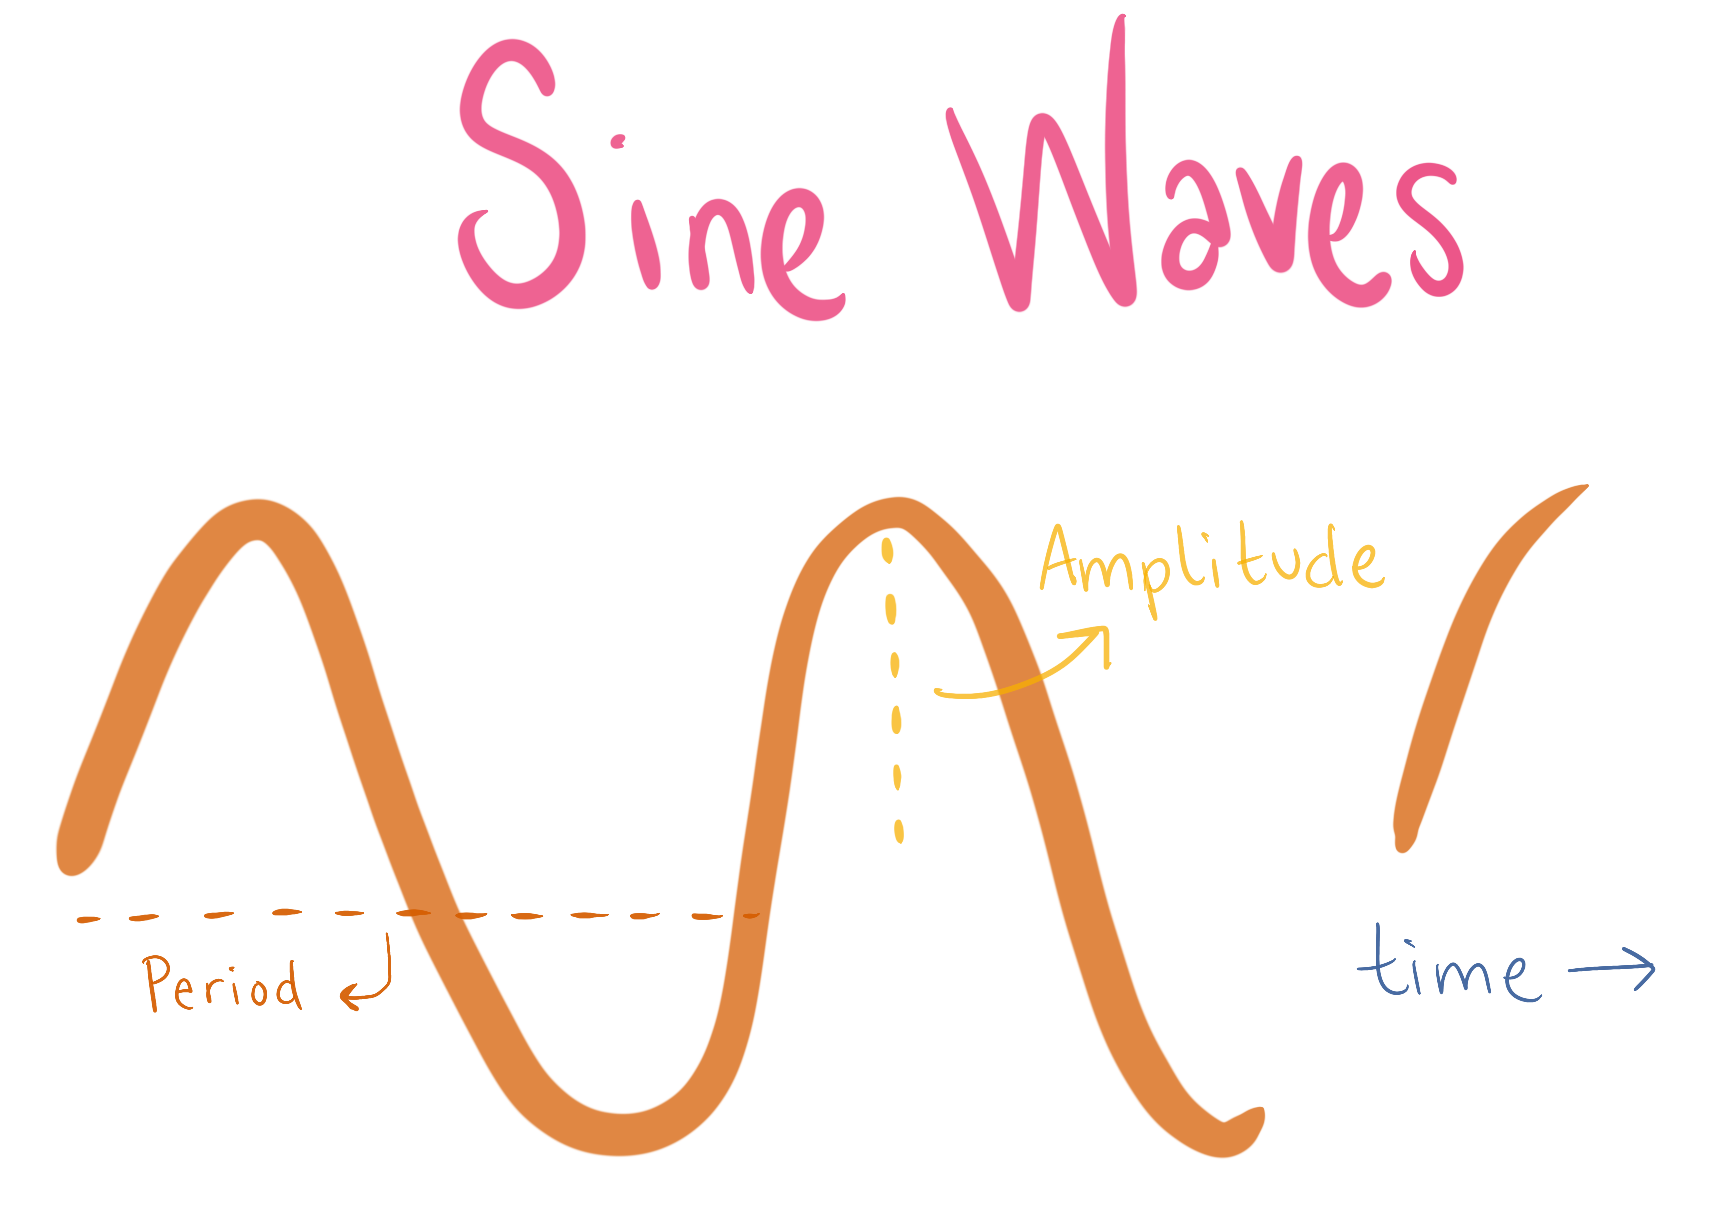
As the value of sine oscillates as a function of time, graphically it looks like a continuous series of waves. This wave can be defined by three values:
- amplitude, the height of the highest point of the wave,
- period, the distance between repetitions of the wave, and
- phase, the position of the wave relative to a reference point (e.g., time = 0 seconds)
Sine Waves: Video Explanations
Intro to Sine Waves
The function, graph, amplitude and period of a sine wave.
Angular Frequency
What angular frequency and frequency are, how they are related and their units of measure.
Frequency and Period
Relationship between frequency and period, how adjusting one affects the other.
Changing Amplitude
Effect of changing amplitude on a sine wave graph and how changing the amplitude of a sound wave affects human perception.
Changing Angular Frequency
Effect of changing angular frequency on a sine wave graph and how the period changes as a result.
Angular Frequency and Octaves
How the angular frequency of a sine wave relates to going up or down an octave in music.
Representing Pitch Through Sine Waves
How sine waves represent pitches and how pitches make up a note.
Human Perception of Oscillations
How we perceive oscillations as a single tone and the limits of human hearing in terms of angular frequency of a sine wave.
Effect of Phase on a Sine Wave
Introduction to what phase is in a sine equation and example graph of how phase shifts the a sine graph horizontally.
Combining Sine Waves
Example of sine waves with different phases and how they combine constructively or destructively. Explanation of how phase is used to create noise cancelling headphones.
Cosine in Terms of Sine
Definition of cosine in terms of sine at a certain phase.
Sine Waves: More Resources
- Getting Started: The Pudding: Let’s Learn About Waveforms.
- For more information on phase, amplitude, angles in degrees and radians, and more, see the Waveforms Observable.
How do logarithms relate to music?
Humans, computers, amplifiers, and musical tuning systems each rely on different numerical systems. Our standard way of counting is based in multiples of 10, but a computer thinks in multiples of 2, because computers are fundamentally built on voltages that are either on or off.
Likewise, we don’t just think of musical pitches in a linear sequence from lowest to highest. We hear different octaves as though they are the same note, and each octave is a doubling of the frequency of the previous octave. Our ears also work this way with amplitude. When you turn up the volume knob on your stereo, each notch isn’t a fixed increment, but a logarithmic increment. A doubling of the amplitude maps into a linear change in our perception. This also means that doubling the amplitude of the vibration of a string or doubling the amount of air that a subwoofer moves doesn’t double the loudness we actually hear.
We also use logarithms to calculate the pitches in our musical tuning system, and this is what allows us to play the same music in any key. The “equal tempered” system means that each of our 12 notes is equally spaced within an octave, the result of a base-12 logarithm.
What are logarithms?
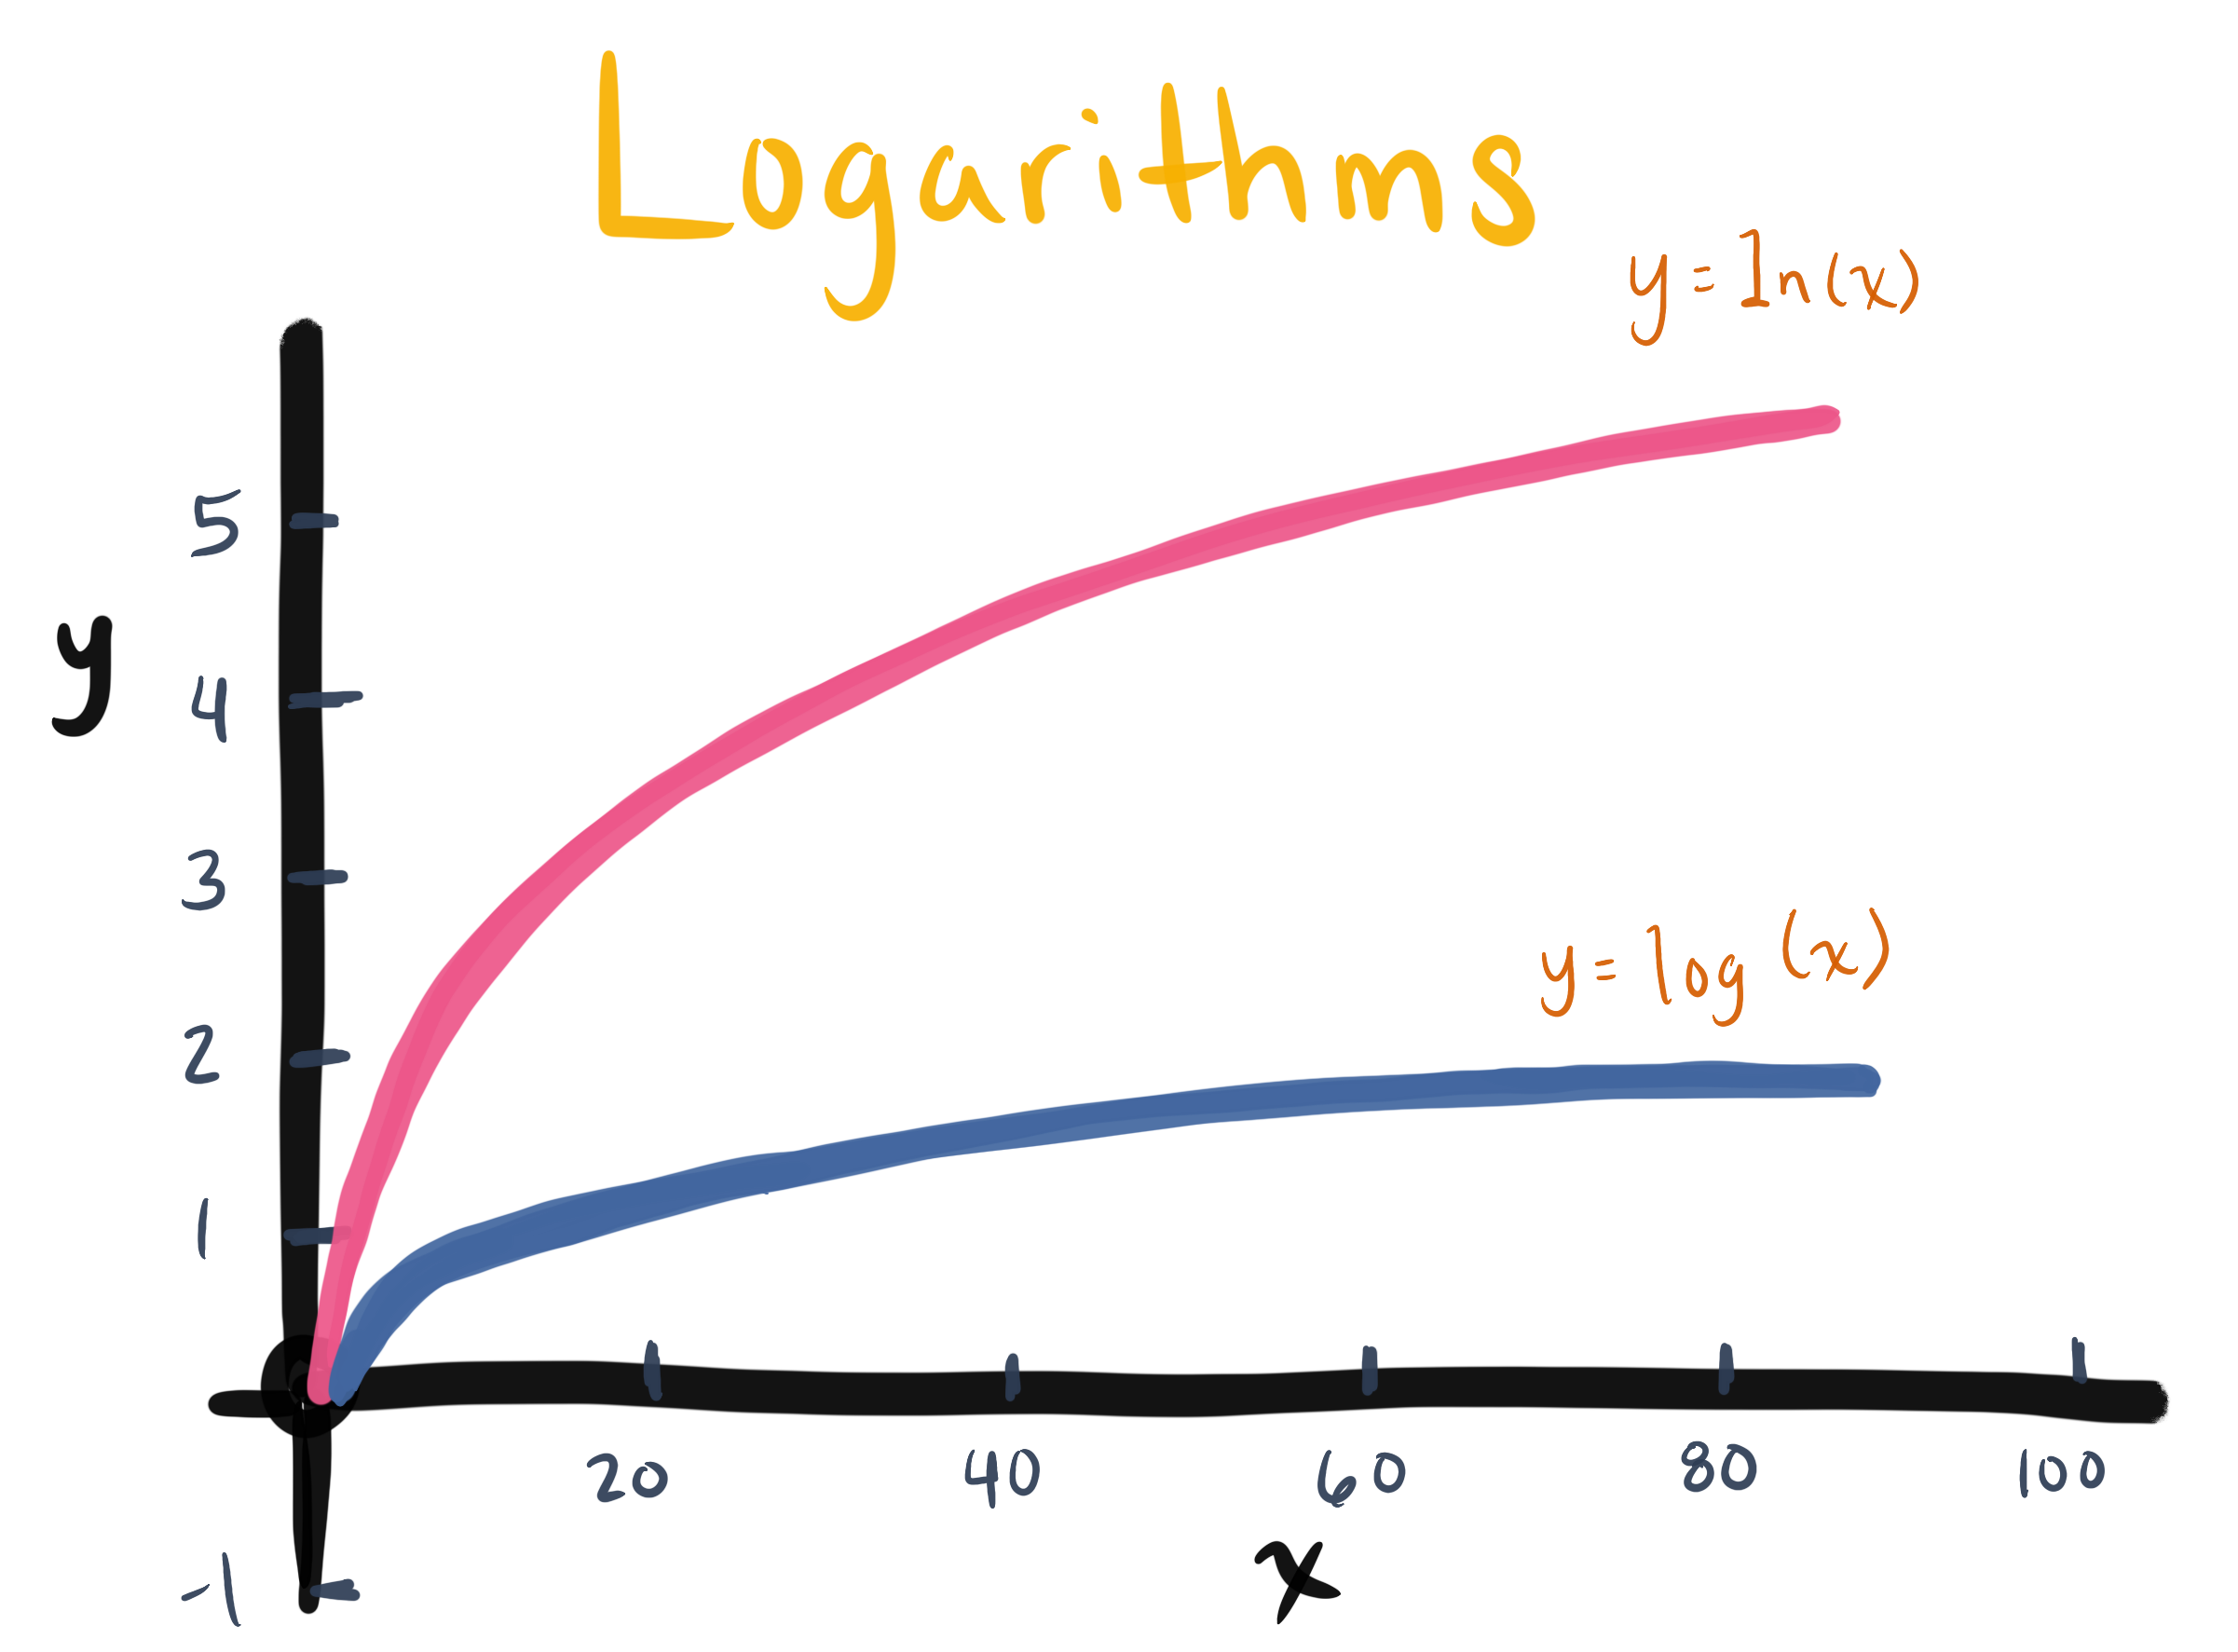
Logarithms capture the relationship between multiplication and addition. Logarithms are formally defined as undoing exponentiation: so if $2^3 = 8$, then $log_{2} 8 = 3$. But they also have the neat property that $log(ab) = log(a) + log(b)$. So logarithms turn multiplying into adding.
A “logarithmic scale” means that a +1 difference on that scale actually represents a multiplication by some value (usually *2, or *10). Think of every value on the scale being passed through a $log(x)$ before reaching the scale. Volume, pitch, and earthquakes are all measured on logarithmic scales.
Logarithms: Video Explanations
Elements of a Logarithmic Sequence
Introduction to linear and logarithmic sequences, examples of each and how they relate to each other. This section also covers the elements of a logarithmic sequence, including base and exponent.
Logarithms and Binary
How base 2 logarithms are used in computers as binary and how that applies to converting signals from a microphone recording on to a computer.
Logarithms in Terms of Exponents
Alternative definition of a logarithm as a function of a base number raised to a power and an introduction to logarithmic notation and how it translates to english.
Logarithmic Property of Multiplication
Explanation of the logarithmic property of multiplication.
Representing Sound Through Logarithms
Examples of how sound can be represented logarithmically. How octaves are a logarithmic representation of pitches. How human perception of sound is logarithmic to the actual amplitude of the sound wave.
Logarithms: More Resources
How do complex numbers relate to music?
Complex numbers set the stage for some very convenient ways of working with sine waves (and other signals that repeat over time). It’s possible to capture both the amplitude and phase of a sine wave using a single complex number, and also to express those relationships graphically. Much of the math behind signals is built using complex numbers to take advantage of this efficiency.
What are complex numbers?
Complex numbers are a number system where the square root of $-1$ is declared to be a valid number. For example, the number $4$ has two square roots: $2$ and $-2$. But what number would you square to get $-4$? This is where the square root of $-1$ (usually called $i$ for “imaginary”) comes to the rescue.
$i = \sqrt{-1}$
A complex number can be expressed in terms of two components: a real part and an imaginary part. The real part is what we’re all used to when we think of numbers: like $1$, $3$, $5$, $\pi$, and so forth. The imaginary part is a real number multiplied by $i$.
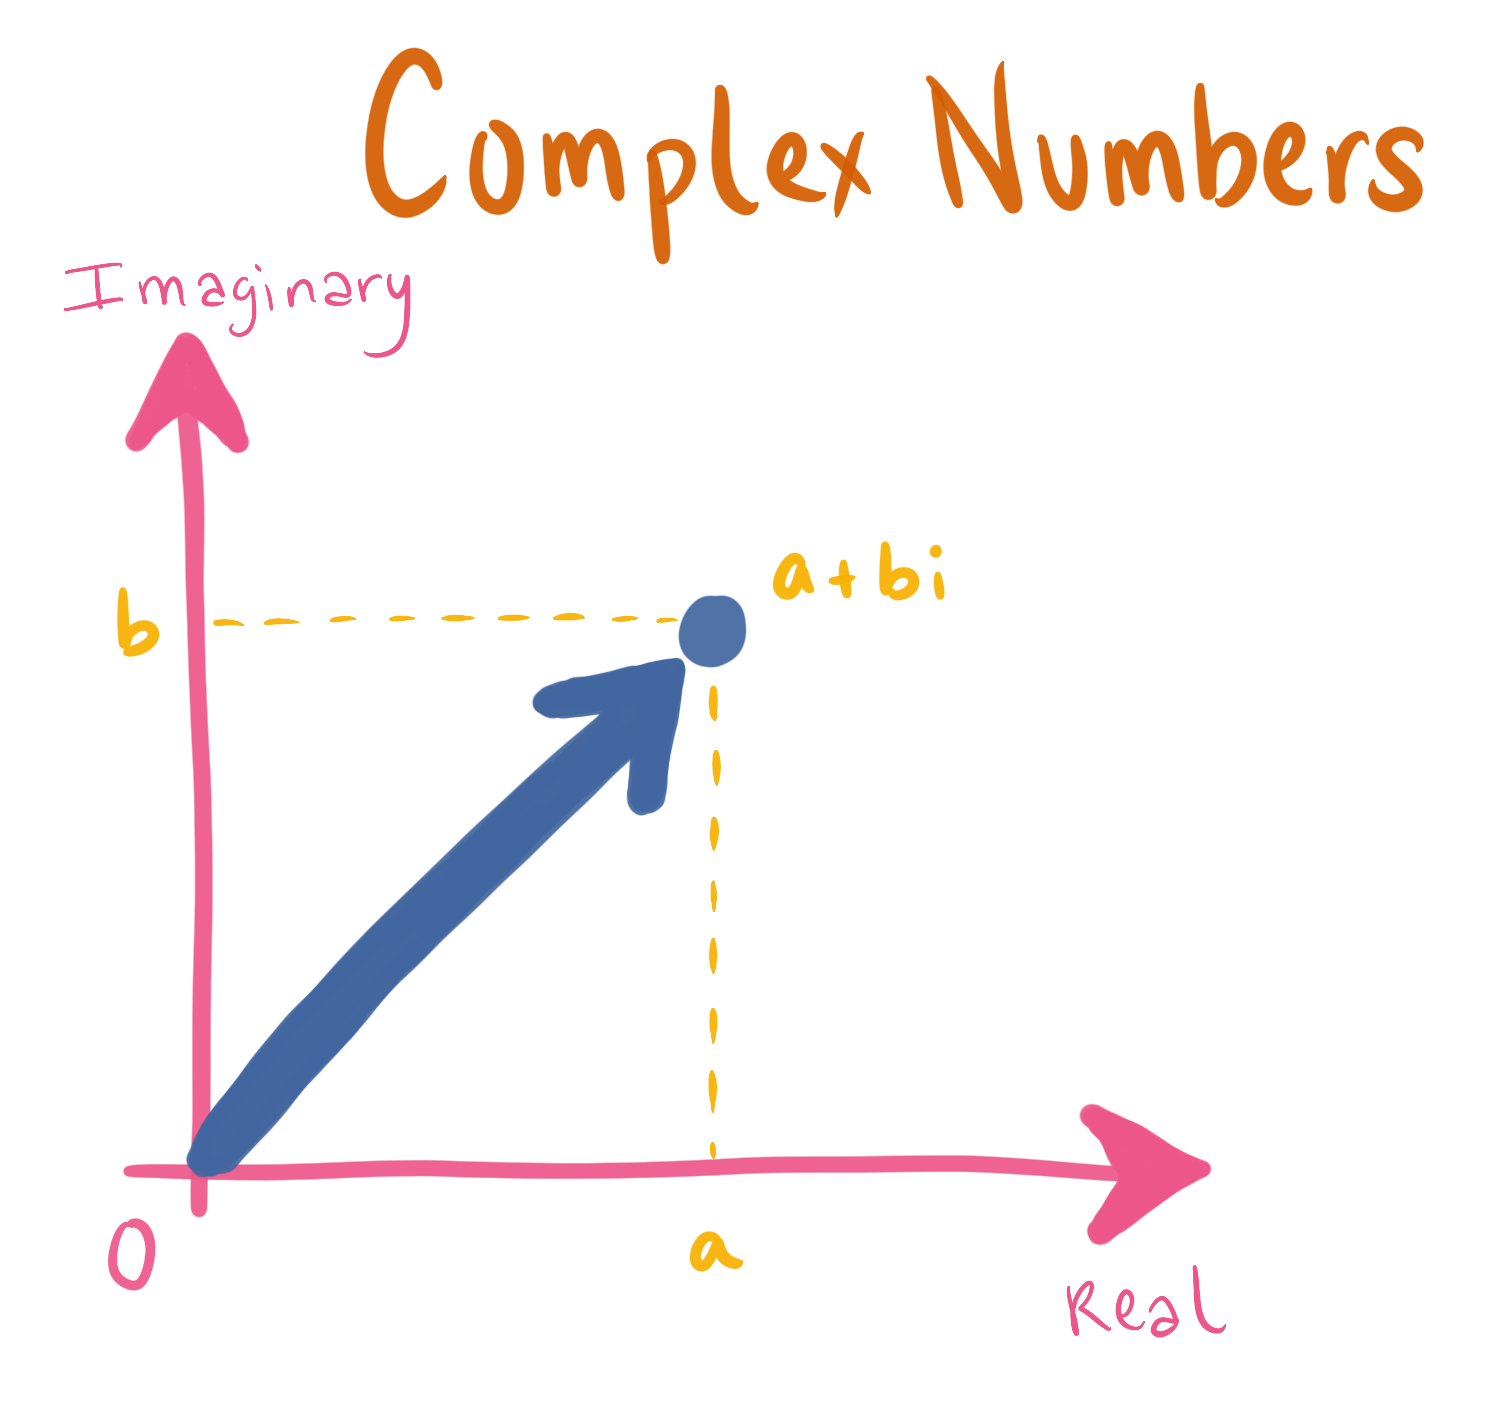
Complex numbers are usually graphed on the “complex plane”. You may be familiar with the number line, a one-dimensional line that describes all real numbers, with zero in the middle, positive numbers on the right and negatives on the left. the complex plane is a two-dimensional plane, where zero is still in the middle, positives on the right, and negatives on the left, but this time multiples of $i$ go upwards from zero, and multiples of negative $i$ go downwards from zero. So to graph a number $a+bi$, you’d go right or left depending on the value of $a$, then go up or down depending on the value of $b$.
The following are examples of complex numbers: $1+2i$, $1.56+10i$. All real numbers can also be represented as complex numbers by having a zero imaginary part: $2+0i$, $-100+0i$, and so on.
So multiplication, an abstract, algebraic thing to do, is transformed into rotating and scaling, a visual, geometric thing to do. That’s the beauty of complex numbers!
Complex Numbers: Video Explanations
Complex Numbers and Number Sets
Definition of a complex number as a number set. Break down of the real, imaginary and $i$ components of a complex number.
Definition of $i$
Definition of $i$ in a complex number and its properties in terms of raising it to a power.
Differences Between Number Sets
Examples of why different number sets (real, whole, integers, complex, etc.) are used over the others.
Properties of Complex Numbers
Addition and multiplication properties of complex numbers.
Complex Numbers and Signals
Why complex numbers are important with examples of how they can be used to represent the relationship between signals.
Signals in the Complex Plane
Definition of a signal in relation to a musical note. Introduction to the complex plane and how to graph complex numbers.
Graphing Complex Numbers
How a signal translates to a graph of a complex number. How the amplitude of a signal translates to the magnitude of a vector.
Displacing a Signal
Explanation of how displacing a signal horizontally represents the angle of its corresponding vector.
Application of Complex Numbers
Why using complex numbers is a better way to represent signals than an X and Y plane.
Complex Numbers and Differential Equations
General overview of how solutions to differential equations can be complex numbers.
Complex Numbers: More Resources
- Khan Academy: Imaginary Numbers
- What are the square roots of -1?
How do derivatives and integrals relate to music?
As we mentioned in the sine waves section, sine waves can represent sounds, pitches, and notes in music. They are the foundational building blocks of sound. You can adjust a sine wave’s amplitude, frequency, period, and wavelength to change the pitch it represents; however, there is much more you can do to characterize these waves. That’s where derivatives and integrals come in. Since derivatives and integrals characterize functions, we can use them to characterize and represent sine waves. Derivatives can give you the slope of the sine wave at any given value, while integrals can give you the area underneath the curve. More importantly, we can use derivatives and integrals to build differential equations, which can model complex energy exchanges, such as oscillations. On its own, a single derivative can’t represent much in music, but second, third and higher order derivatives can be used in a differential equation to build an oscillator, which is a basic building block in music.
What are derivatives and integrals?
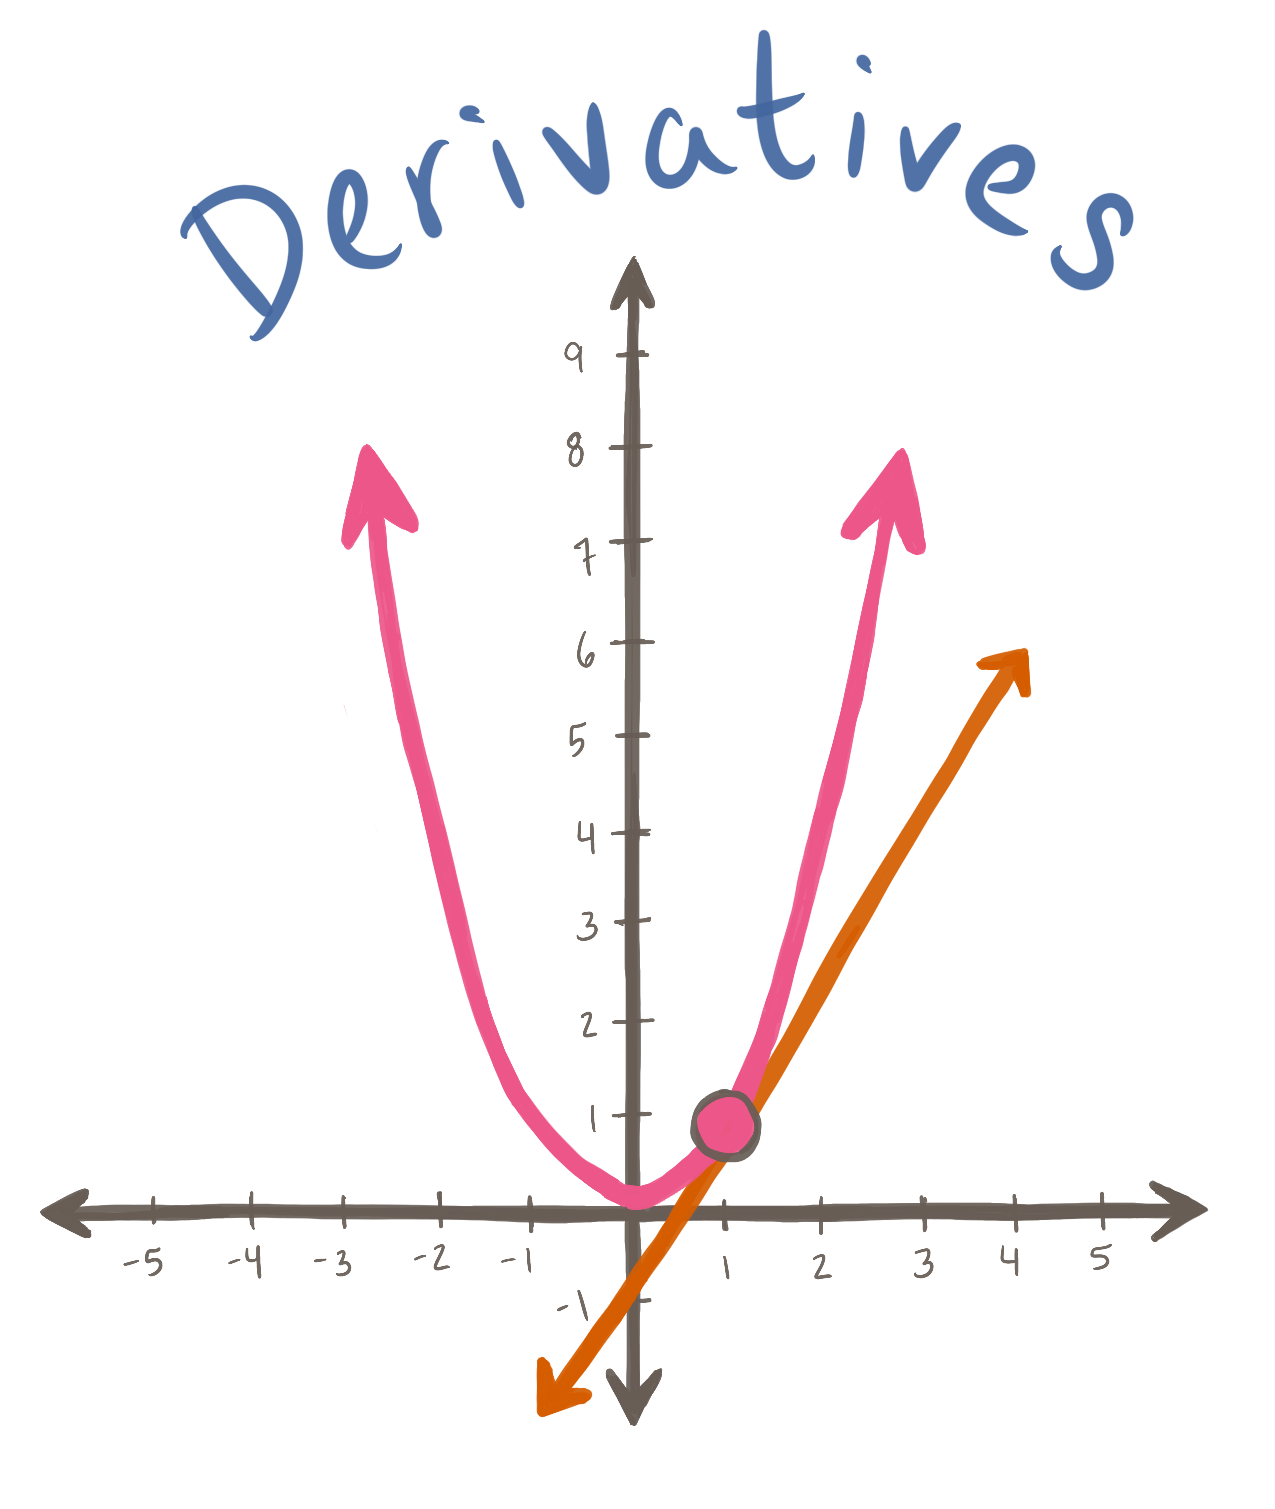
Derivatives and integrals come from calculus, the study of functions and how they change over time. In mathematics, this refers to how the slope of a function (such as a line or a polynomial) can change as you move along the graph. If you are looking at the graph of a horizontal line for example, the slope is always constant. If you wanted to characterize the slope of a more complicated function, like a parabola, you could pick individual points on the graph and find the slope, but you couldn’t find the slope at every point. That’s where derivatives come in. A derivative is an expression that gives the slope of a function at any point you plug into it.
What does the change of a function over time really mean though? Well, think of traveling in a car. We can say the function in this case is your distance at every time (at 0 sec, 1 sec, 2 sec etc.). Now say you want the velocity you’re traveling at, you would want to find how your distance traveled changes over time, or the derivative. So in this case, distance is the function and velocity is the derivative. If you wanted to find your velocity during a certain time interval you could just take your distance divided by the amount of time it took you to cover that distance; however, with a derivative, you could find the velocity of any instant during that car trip.
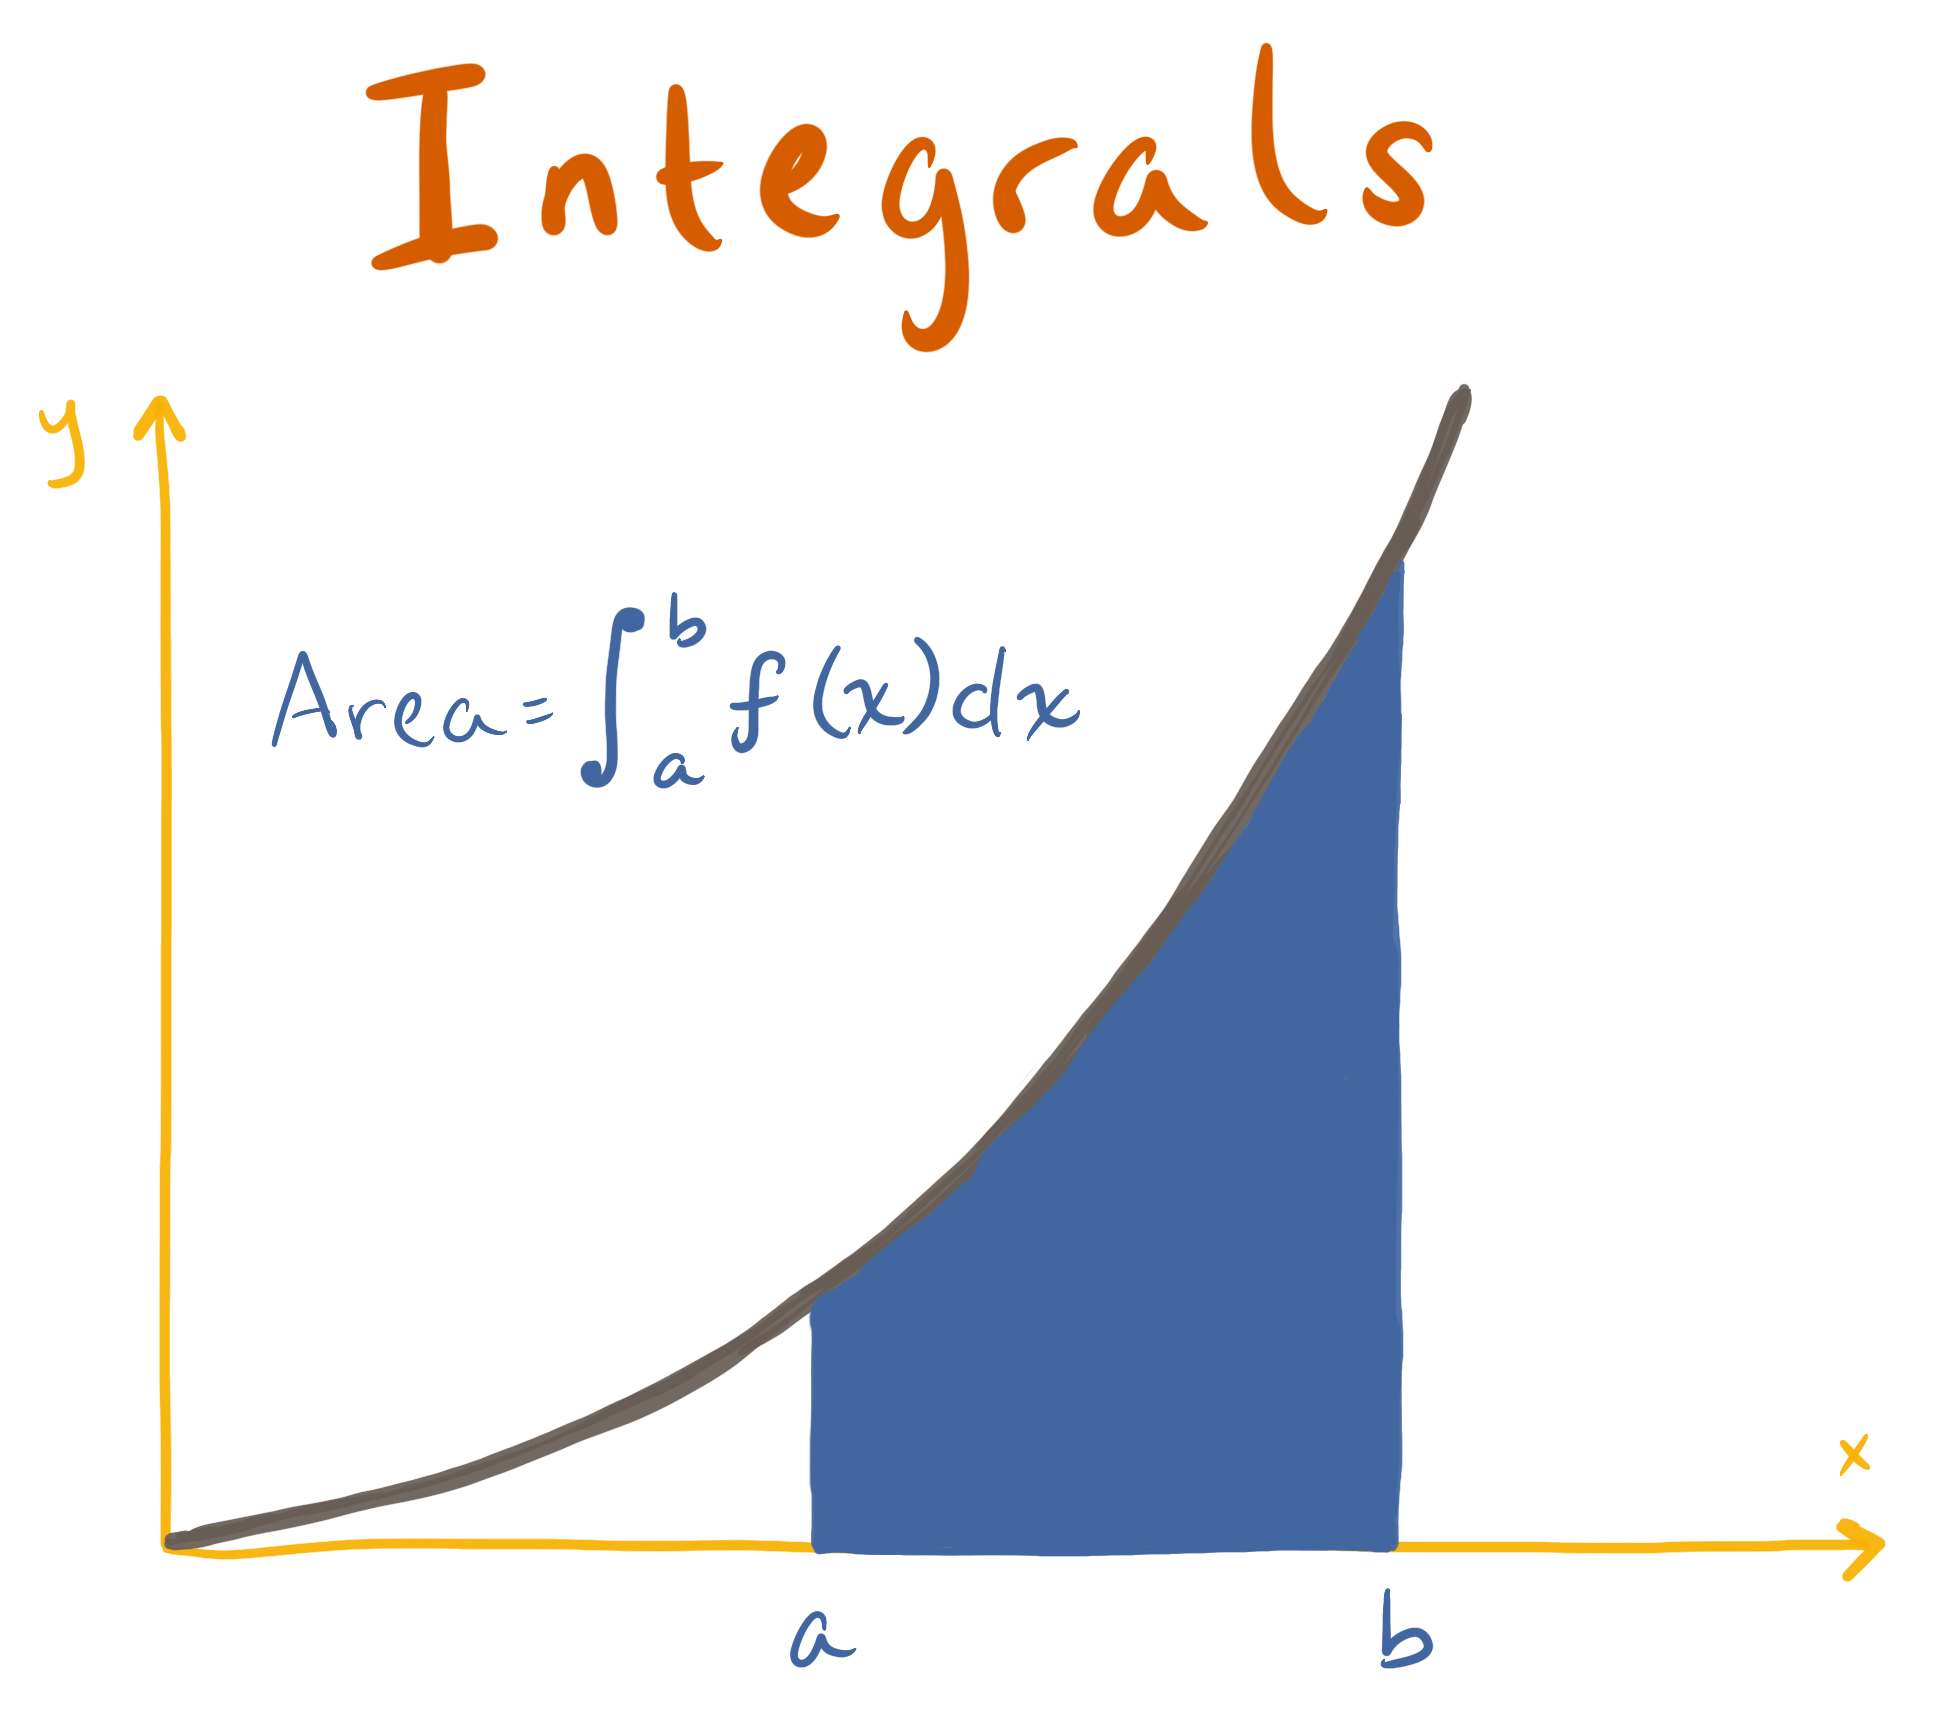
While derivatives represent how the slope of a function changes over time, an integral represents how a function accumulates over time. The best way to think about these two concepts is graphically. Picture the graph of a horizontal line. If you found the slope at a given point on the graph (which in this case is zero), you are finding the derivative of the function. If you found the area underneath the function on a certain interval, such as 0 to 3 (which in this case is just the y value of the horizontal line times 3), you would be finding the integral.
What can the accumulation of a function actually be used for? Let’s go back to our traveling in a car example. Now let’s say that you know your velocity and you want to find your distance over time. You could graph your velocity as a function of time and find the area underneath the graph. If your velocity graph is a polynomial with curves, it’s a little more challenging to get the area than the horizontal line we mentioned before. Instead, you could approximate the area by taking small rectangular sections of the graph that are close to modeling the actual curve. The more rectangular sections you slice it into, the more accurate your approximation of the area. By taking the integral of the function, you are taking an infinite number of slices and therefore getting the exact area and in this case, the exact distance over time.
So, if the derivative of distance is velocity and the integral of velocity is distance, we see there is an inverse relationship between these two concepts and that you can use one to find the other. This is why an integral is also called an antiderivative. These two ways of representing changes in functions are interconnected and together make up calculus.
Derivatives & Integrals: Video Explanations
Intro to Derivatives
Definition of a derivative and examples of what a derivative is graphically. What makes a function “differentiable” and what a solution to a differential equation represents.
Properties of Derivatives
Multiplying by a constant, addition rule, product rule, chain rule, and exponent rule.
Derivative of $e$
How to find the derivative of $y=e^x$ and the properties of $e$ as a transcendental number.
Derivative of Natural Logarithm
Definition of a natural logarithm and how to find its derivative (logarithm rule)
Derivative Examples
Worked out examples of finding the derivative of a function using all of the rules explained earlier in the video.
Derivative of Sine and Cosine
The rules and properties of deriving sine and cosine explained graphically.
Intro to Integrals
Definition of integrals and how they relate to derivatives explained graphically.
Changing the Limits of Integration
How changing the limits of an integral affects the solution graphically and how to express that in terms of an original area. Proof of why an integral is an antiderivative.
Definition of Integrals in Terms of $dx$
Graphical explanation of what an integral is through taking small slices of an area. Definition of dx.
Characterizing Integrals
Definition of a definite and indefinite integral, proper integral notation and what limits and $dx$ mean.
Integral Properties
Multiplying by a constant, addition rule, power rule, natural log and e rules. What $dx$ represents graphically.
Definite Integrals Explained Graphically
General definition of a definite integral combining the graphical explanations throughout the video.
Derivatives & Integrals: More resources
How do differential equations relate to music?
Sound waves are generated by a physical object that is resonating, and resonating systems are best described by differential equations that are higher than first order. A first order system has no acceleration, so the result won’t have an oscillating behavior.
In a second order differential equation, a second derivative of the function introduces acceleration and creates the oscillating behavior that you’d see in, say, a spring or a pendulum. Once you use a second or higher order differential equation, you can model the movement of energy back and forth, which can model musical systems that are more complex.
What are differential equations?
A differential equation is a mathematical equation that relates a function with its derivatives. Since derivatives represent the rate of change of a function, relating an equation to its derivatives can be useful in showing change over time. They allow us to model more complex motion than just a single function can.
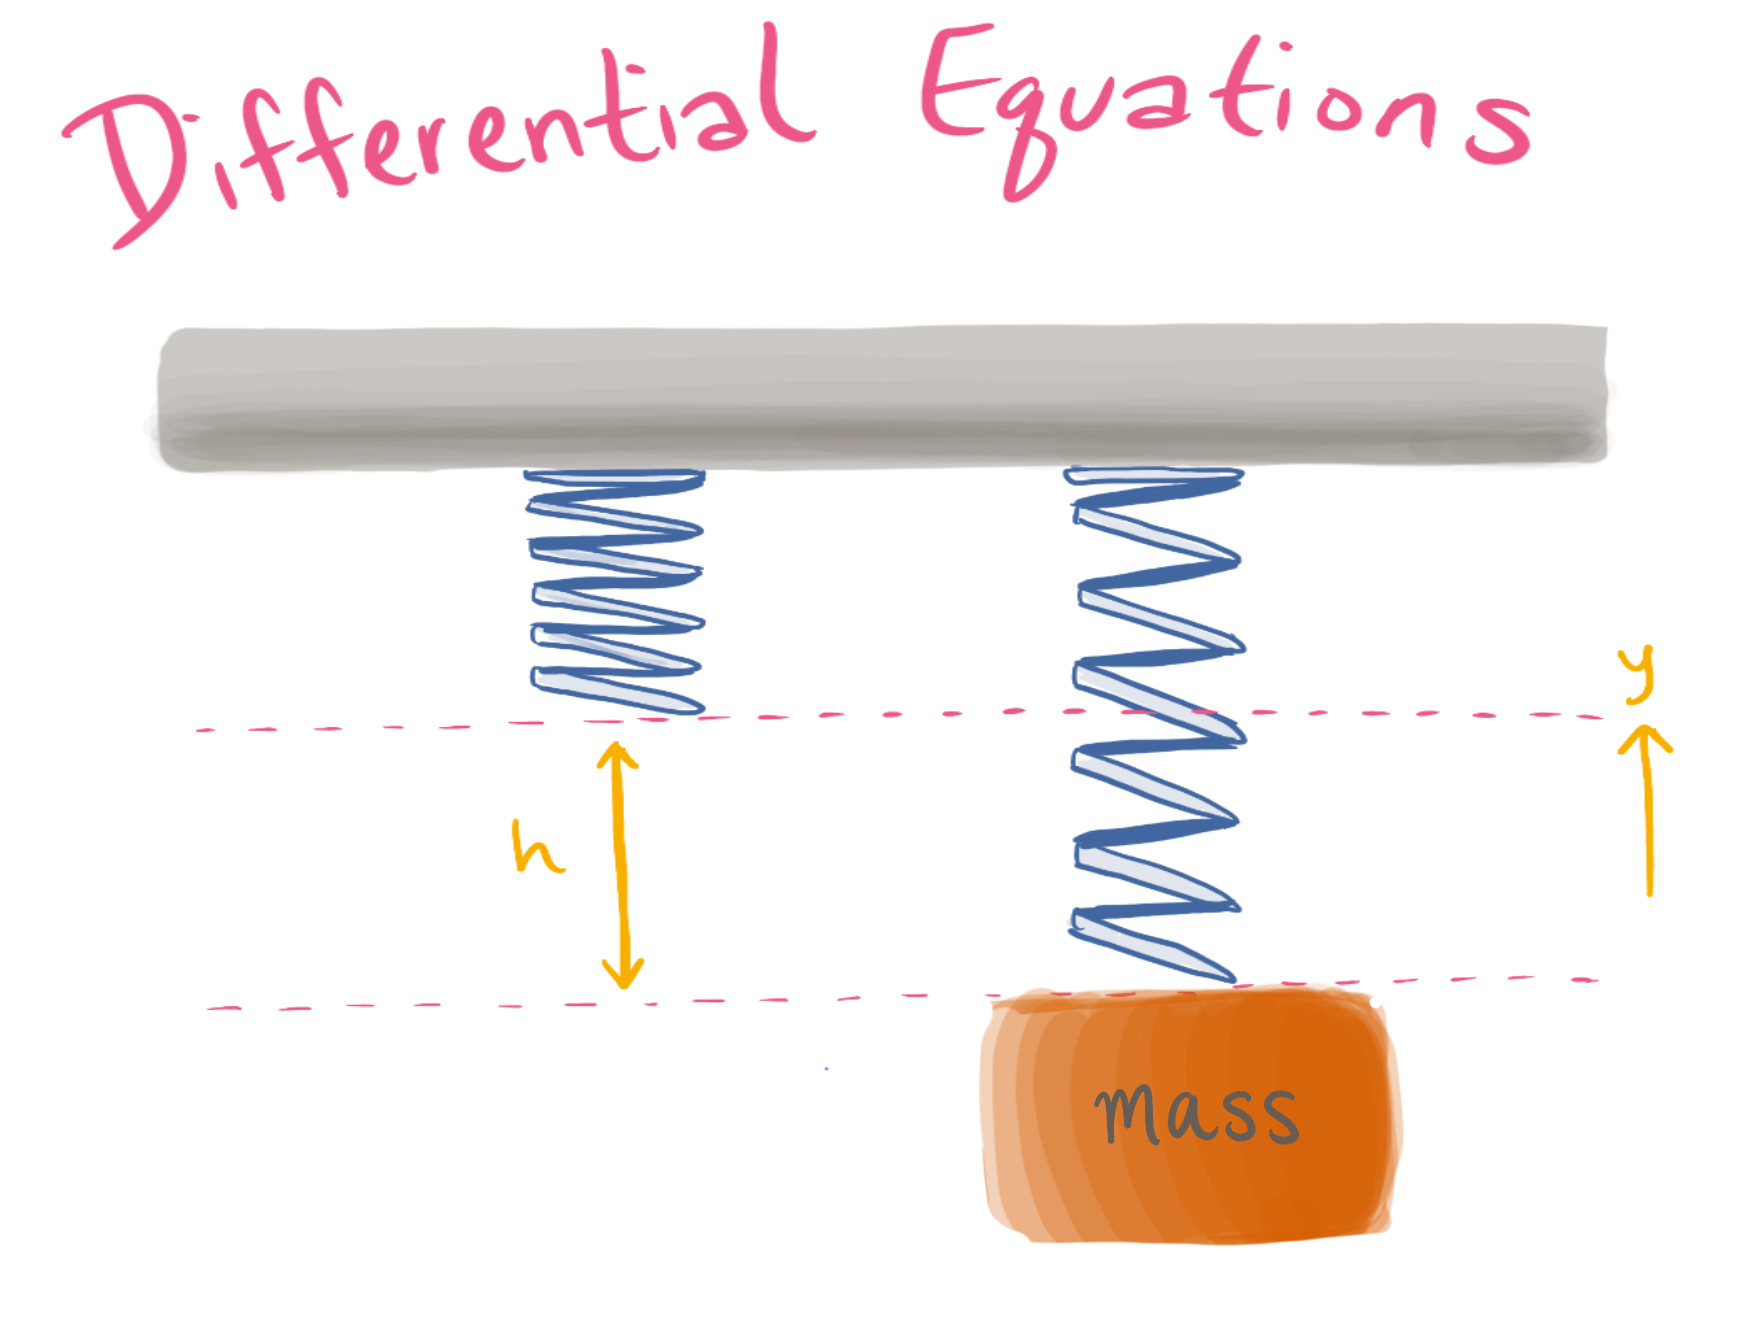
Think of a mass on a spring bouncing up and down. We can use Newton’s second law to characterize this motion which states:
$F = ma$
Here, $F$ stands for force, $m$ stands for mass, and $a$ stands for acceleration. In this case the mass is constant, so we only need to consider force and acceleration as variables in creating our differential equation.
By another physical principle, Hooke’s Law, we know the force of a spring is equal to a constant $k$ multiplied by the displacement of the spring. Combining these two concepts, we can say:
$kx=ma$
Here, $x$ is displacement and $a$ is acceleration of the mass as a function of time. As we mentioned in the derivatives and integrals section, if you take the derivative of displacement over time twice, you get the acceleration over time. So we can rewrite the equation of the movement of the spring in terms of one function, displacement over time, and its derivatives. So we can say:
$-kx = m \frac {d^2x}{dt^2} $
Here, the $\frac {d^2x}{dt^2}$ is the second derivative of $x$. This differential equations allows us to model the complex motion that is oscillating in one simple equation. This is useful because you can relate the movement of the mass on the spring with its acceleration with only one function, instead of two.
Differential Equations: Video Explanations
Algebraic Expressions
Definition and example of an algebraic expression and its graph.
Intro to Differential Equations
Definition of a differential equation, an example of one, and how it differs from an algebraic expression.
Solutions to Differential Equations
What a solution to a differential equation looks like and an example.
Checking a Solution to a Differential Equation
How to check if a function is a solution to a differential equation by using derivatives to plug it back in. Example of what a differential equation and its solution could be used to model.
Properties of Differential Equations
Properties of ordinary differential equations: linear vs. nonlinear, order and dimension (with examples of each).
Real and Complex Solutions to Differential Equations
General form of a solution to ordinary differential equations and how it differs based on the exponent being real or complex. Defining and using Euler’s identity to find complex solutions.
Differential Equations and Pitch
How ordinary differential equation solutions with a complex exponents look graphically and how they are linked to frequency and pitch in music.
More Complex Differential Equations
Examples of what makes up a complex differential equation regarding dimensionality, order and linearity. Introduction to what a partial derivative is.